# Browser inspecting tools
A core aspect of developing websites is using browser developer tools. They can give you key insights into what's happening in the browser and how it's interpreting your code.
Each browser's tools are slightly different, so I'll just go over the most common elements and demonstrate them in class.
# The Inspector / Elements
The Inspector shows you the browser's interpretation of your HTML: the DOM, or "Document Object Model". It typically shows the DOM as a collapsible tree and has a separate panel that shows CSS styles.
Bring up the tools by right or control-clicking on an element in the page, and choose "Inspect Element."
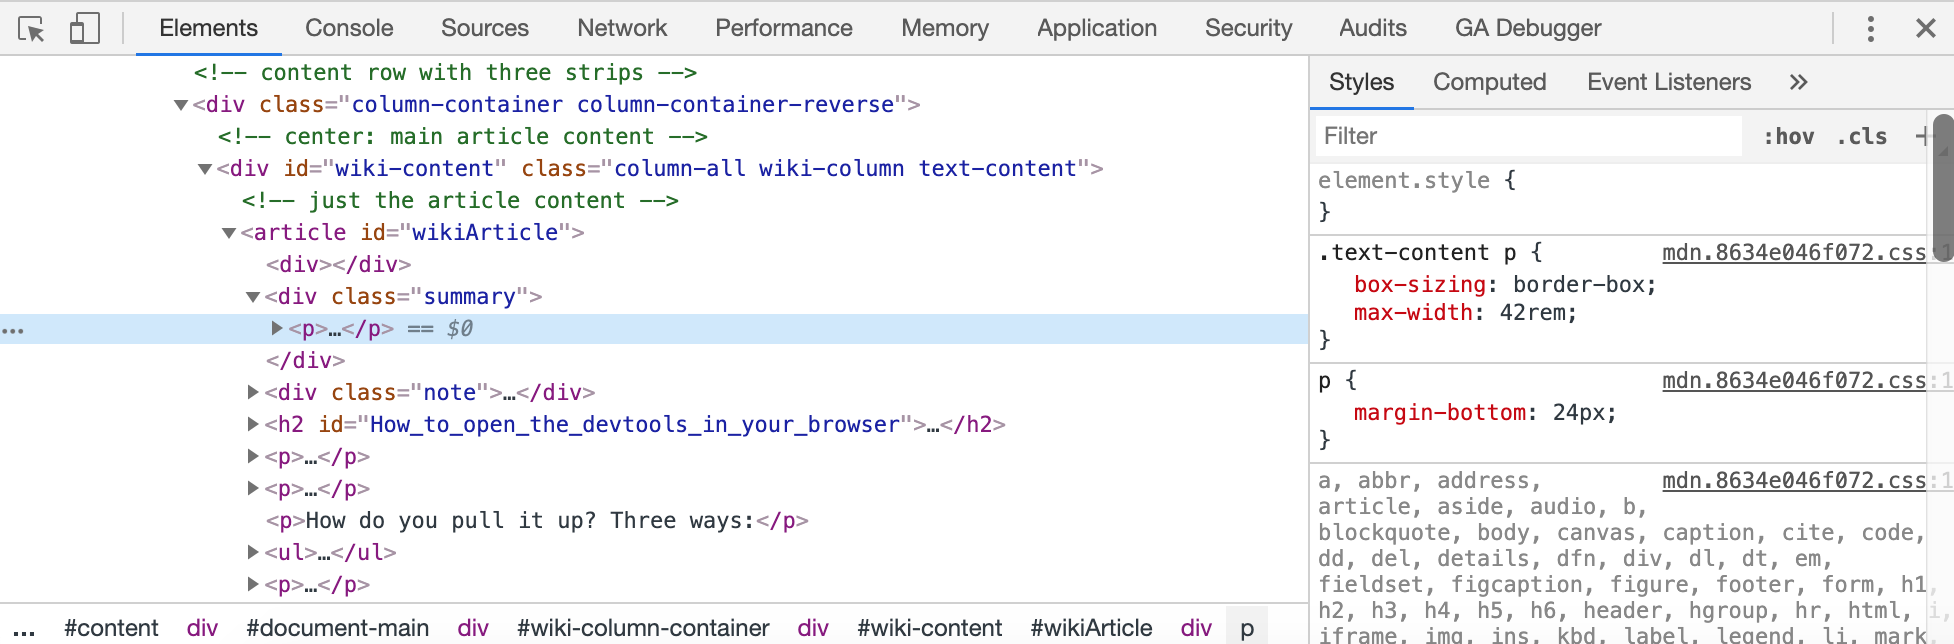
- When you hover over an element, it will highlight on the page, showing color-coded padding and margin.
- The style panel will show styles in order of most specific down, crossing out rules that have been overwritten.
If you only remember these two features, you will get a lot out of this tool.
You can also usually see a list of computed styles, the ones the browser has determined from your rules. It will often have an illustration showing all box model settings. It typically also has tools to simulate hover and other states.
You can also delete and duplicate nodes, and edit the HTML and the CSS in the browser and see immediate changes. This is often very useful for exploring small changes and debugging problems. Once you reload the page, those changes will go away.
You can also uncheck style rules and see if turning off some styles will help you figure something out, or add very specific element styles.
# JS Console
The JS console lets you run javascript code, and reports errors and warnings. If you are getting into Javascript at all, even just installing a plugin, you'll want to check here if something isn't working.
# Network Console
The network console will let you record the loading of the page, view speed and sizes of assets, as well as see the order they load, and any 404 errors (broken link errors). It will also let you disable the browser cache and simulate slower internet speeds. It's a good place to diagnose slow parts of your page, and to confirm assets you expect to load are loading.
# Responsive tools
Sometimes the browser's responsive simulations our accessed here, sometimes not. Every browser is slightly different, so here are some browser specific explanations...
MDN: What are browser developer tools? (opens new window)
Firefox Developer Tools (opens new window)
Firefox Responsive Design Mode (opens new window)
Chrome Developer Tools (opens new window)
Simulate Mobile Devices with Device Mode in Chrome DevTools (opens new window)
Safari Developer Tools (opens new window)
How to use Responsive Design Mode in Safari (opens new window)
# More!
These tools are improving all the time. Firefox just launched a typography inspector that lets you use sliders to adjust font properties to your liking, and it also has the best Flexbox and Grid visualizations.